
Page 2 - Decision_Impact_Scale_Sample
P. 2
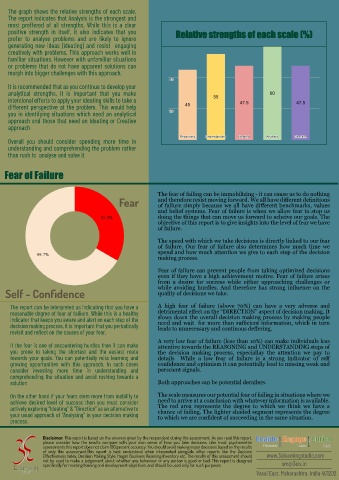
The graph shows the relative strengths of each scale.
    The report indicates that Analysis is the strongest and
    most preffered of all strengths. While this is a clear
    positive strength in itself, it also indicates that you    Relative strengths of each scale (%)
    prefer to analyse problems and are likely to ignore
    generating new ideas (ideating) and resist engaging
    creatively with problems. This approach works well in
    familiar situations. However with unfamiliar situations
    or problems that do not have apparent solutions can
    morph into bigger challenges with this approach.

    It is recommended that as you continue to develop your
    analytical strengths, it is important that you make
    intentional efforts to apply your ideating skills to take a
    different perspective at the problem. This would help
    you in identifying situations which need an analytical
    approach and those that need an Ideating or Creative
    approach

    Overall you should consider spending more time in
    understanding and comprehending the problem rather
    than rush to analyse and solve it


   Fear of Failure


                                                        The fear of failing can be immobilizing - it can cause us to do nothing
                                           Fear         and therefore resist moving forward. We all have different definitions
                                                        of failure simply because we all have different benchmarks, values
                                                        and belief systems. Fear of failure is when we allow fear to stop us
                                                        doing the things that can move us forward to acheive our goals. The
                                                        objective of this report is to give insights into the level of fear we have
                                                        of failure.
                                                        The speed with which we take decisions is directly linked to our fear
                                                        of failure. Our fear of failure also determines how much time we
                                                        spend and how much attention we give to each step of the decision
                                                        making process.

                                                        Fear of failure can prevent people from taking optimized decisions
                                                        even if they have a high achievement motive. Fear of failure arises
                                                        from a desire for success while either approaching challenges or
   Self - Confidence                                    while avoiding hurdles. And therefore has strong influence on the
                                                        quality of decisions we take.
     The report can be interpreted as indicating that you have a  A high fear of failure (above 70%) can have a very adverse and
     reasonable degree of fear of failiure. While this is a healthy  detrimental effect on the “DIRECTION” aspect of decision making. It
     indicator that keeps you aware and alert on each step of the  slows down the overall decision making process by making people
     decision making process, it is important that you periodically  need and wait for more than sufficient information, which in turn
     revisit and reflect on the causes of your fear.    leads to unnecessary and continous deffering.

     If the fear is one of encountering hurdles then it can make  A very low fear of failure (less than 10%) can make individuals less
                                                        attentive towards the REASONING and UNDERSTANDING steps of
     you prone to taking the shortest and the easiest route  the decision making process, especiallay the attention we pay to
     towards your goals. You can potentially miss learning and  details  While a low fear of failure is a strong indicator of self
     growing opportunities with this approach. In such cases  confidence and optimism it can potentially lead to missing weak and
     consider investing more time in understanding and  perscient signals.
     comprehending the situation and avoid rushing towards a
     solution                                           Both approaches can be potential derailers.

     On the other hand if your fears stem more from inability to  The scale measures our potential fear of failing in situations where we
     achieve desired level of success then you must consider  need to arrive at a conclusion with whatever information is available.
     actively exploring “Ideating” & “Direction” as an alternative to  The red area represents the degree to which we think we have a
     your usual approach of “Analysing” in your decision making  chance of failing. The lighter shaded segment represents the degree
     process.                                           to which we are confident of succeeding in the same situation.


                Disclaimer: This report is based on the answers given by the respondent during the assessment. As you read this report,
                please consider how the results compare with your own sense of how you take decisions. Like most psychometric
                assessments this report does not claim 100 percent accuracy. You should avoid making major decisions based on the results
                of only this assessment.This report is best understood when interpreted alongside other reports like the Decision
                Effectiveness Index, Decision Making Style, Hogan Business Resoning Inventory etc. The results of this assessment should  www.3elearningstudio.com
                not be used to make a judgement about whether any behaviour or any person is good or bad. This report is designed
                specifically for meeting training and development objectives, and should be used only for such purposes.  sm@3els.in
                                                                                           Vasai East. Maharashtra. India 401202