
Page 1 - Decision_Impact_Scale_Sample
P. 1
Sample Report Date: 2 June 2021
nd
This report plots the effectiveness of each step in the decision making process. The decision making process starts
with Reasoning where we use our cognitive skills and preferences to size up a situation. Our thinking habits and
biases reside here and influence the rest of the decision making process. Step 2 is Understanding where we use our
cognitive skills to connect the peices together, define the problem we face and understand the magnitude of the
challenge we have. In step 3 we begin reconnecting the peices we took apart in Step 2 and rebuild the challenge
from our perspective. We do this with a combination of our “Analytical” and “Ideating” skills, though we usually
prefer one skill over the other. Step 4 is the final and perhaps the most important step in our decision making
process where we implement and execute the decision that we have taken.
The Decision Impact Scale measures the attention we pay and importance we give to each of these steps. Since we
prefer engaging more on some steps than on others, those steps will appear as relatively stronger than others. The
objective of this scale is to help us identify the strongest and the weakest links in our decision making process.
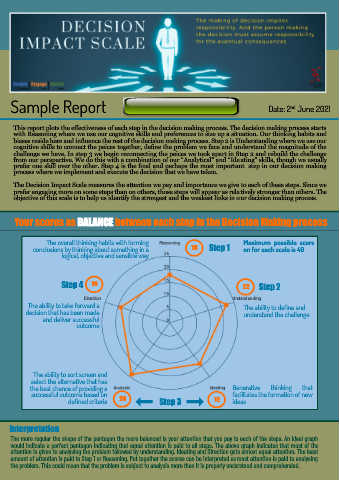
Your scores as BALANCE between each step in the Decision Making process
The overall thinking habits with forming Maximum possible score
conclusions by thinking about something in a 18 Step 1 on for each scale is 40
logical, objective and sensible way
Step 4 19 22 Step 2
The ability to take forward a The ability to define and
decision that has been made understand the challenge
and deliver successful
outcome
The ability to sort screen and
select the alternative that has
the best chance of providing a Generative thinking that
successful outcome based on facilitates the formation of new
defined criteria 24 Step 3 19 ideas
Interpretation
The more regular the shape of the pentagon the more balanced is your attention that you pay to each of the steps. An ideal graph
would indicate a perfect pentagon indicating that equal attention is paid to all steps. The above graph indicates that most of the
attention is given to analysing the problem followed by understanding. Ideating and Direction gets almost equal attention. The least
amount of attention is paid to Step 1 or Reasoning. Put together the scores can be interpreted as most attention is paid to analysing
the problem. This could mean that the problem is subject to analysis more than it is properly understood and comprehended.